
Executive Summary
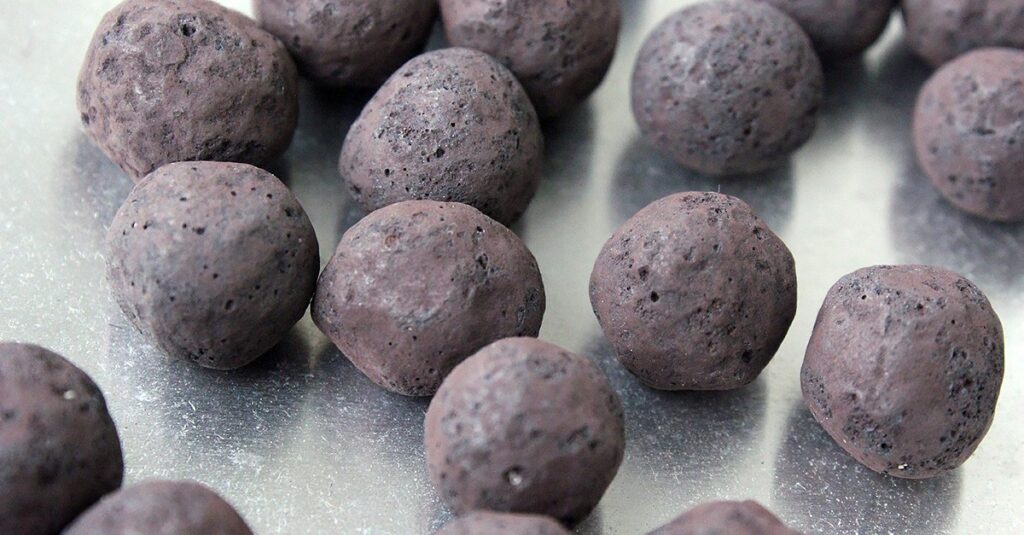
This report details the engineering approach applied to optimize the bentonite dosing system within an iron ore pelletizing plant. Precise binder dosage is critical for the mechanical integrity of green pellets before induration.
The Operational Challenge: The previous control system utilized a standard PI controller, which failed to manage the process’s significant transport delays (26.3 s). Operational data revealed critical inefficiencies:
- Quality Risk & Waste: An overshoot of approx. 45% caused inconsistent pellet composition and unnecessary raw material consumption.
- Asset Reliability: The actuator (VFD) exhibited extreme variability, reaching a peak capacity of 97.11%. This near-saturation behavior accelerates mechanical wear and increases the risk of premature motor failure.
- Process Instability: A slow settling time combined with a high error integral (ISE: 8.56) indicated the process spent significant time off-spec.
The objective was to implement a tiered control strategy to stabilize the flow, comparing a Zero-CapEx PID optimization against a high-performance Model Predictive Controller (MPC).
System Identification and Modelling
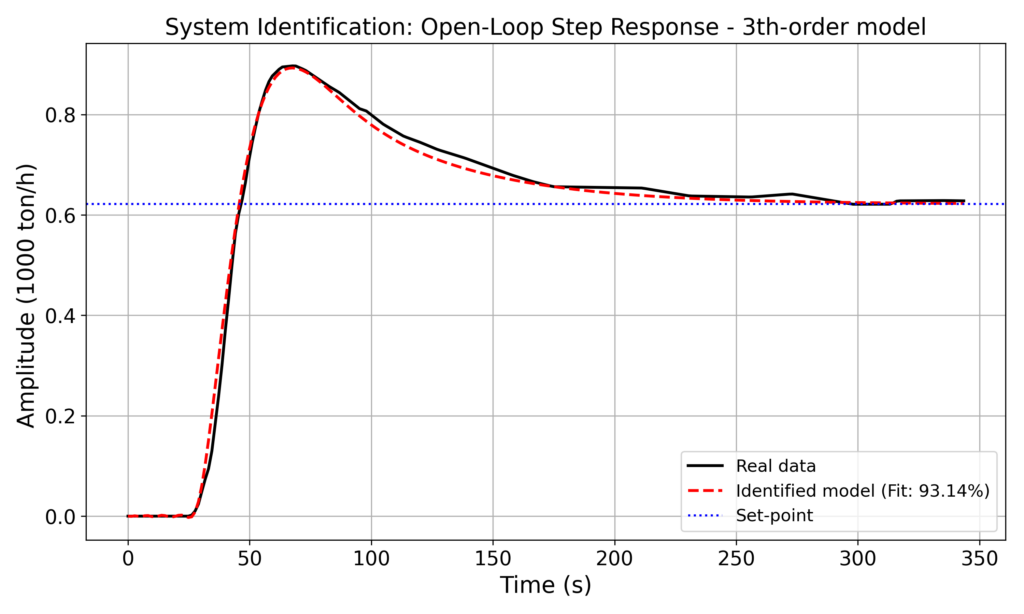
To transition from “trial and error” tuning to engineered precision, an open-loop step test was performed. The data was analyzed to generate a high-fidelity “Digital Twin” of the process.
High-Fidelity Modeling – The Digital Twin
A 3rd-order transfer function was identified to capture the screw feeder dynamics, including the dominant transport delay of 26.3 seconds. The resulting model has the following structure
and a graphical comparison is shown in Figure 3.
Tier 1: Classical Control Optimization (PI vs PID)
Before exploring advanced control, a rigorous analysis of classical control structures was conducted. A “one-size-fits-all” approach was rejected in favor of two application-specific tuning strategies. For all control laws, the frequency used is 1/15 Hz.
The Engineering Trade-Off
The dominant dead time (26.3 s) presents a fundamental conflict between stability and speed.
- Robust PI: Prioritizes stability margins (Phase Margin > 70◦).
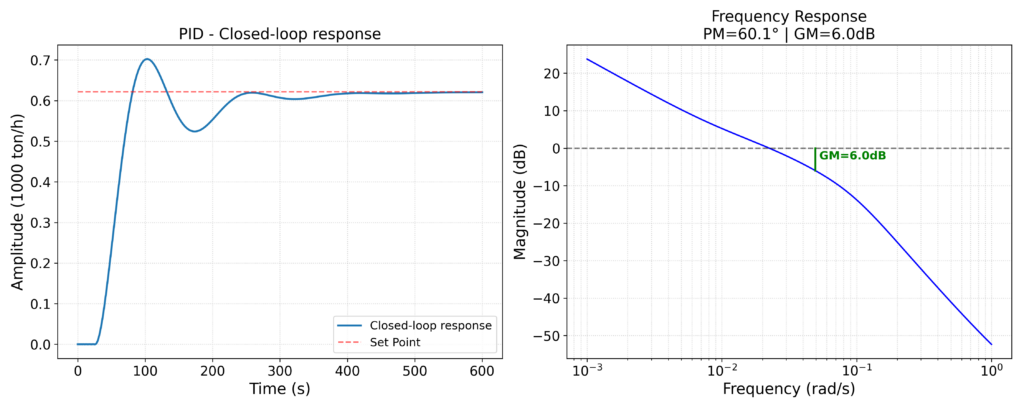
- Aggressive PID: Prioritizes bandwidth and disturbance rejection (Phase Margin ≈ 60◦);
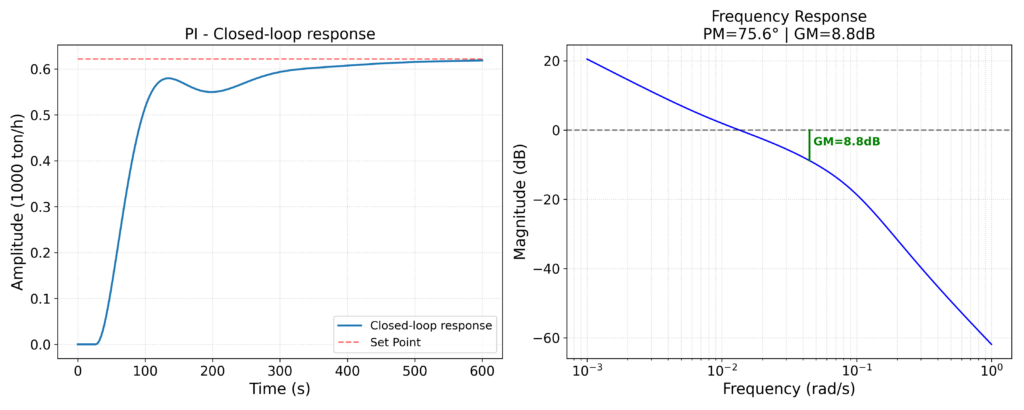
Case A: Robust PI (Precision Batching)
Designed for batch-dosing operations, where the primary constraint is “Zero Overshoot” to prevent material waste that cannot be recovered.
- Performance: Achieved a critically damped, monotonic response with 0% overshoot.
- Trade-off: Slower rise time, acceptable for batch processes where accuracy outweighs speed.
Case B: Aggressive PID (Continuous Feed)
Designed for Continuous Throughput, where maintaining mass flow rate against load torque disturbances is critical.
- Performance: The addition of derivative action improved the rise time by 40% compared to the PI controller.
- Trade-off: Introduces a slight overshoot (15%), which is a calculated risk to ensure faster recovery from load disturbances.
Tier 2: Advanced Control (MPC Solution)
While the Aggressive PID improved rise time, it introduced a 15% overshoot and oscillatory behavior that stresses the mechanical actuators. To achieve high performance without compromising asset health, a Model Predictive Controller (MPC) was implemented.
Strategy Overview
Utilizing the high-fidelity 3rd-Order “Digital Twin,” the MPC predicts future process behavior over a prediction horizon (𝑁) and optimizes the control sequence to minimize a cost function 𝐽:
Key Advantages for this Unit:
- Dead Time Compensation: The MPC’s internal model “sees” the 26.3 s delay and initiates control action proactively, rather than reacting late like the PID.
- Constraint Handling: The controller explicitly solves for 0 ≤ 𝑢(𝑡) ≤ 100, preventing the saturation spikes observed in the legacy system.
- Model Uncertainty Handling: Discrepancies between the model and the real plant are handled by augmenting the system state with an integrator component.
MPC Simulation Results
The MPC response demonstrates superior control quality compared to both PID strategies.
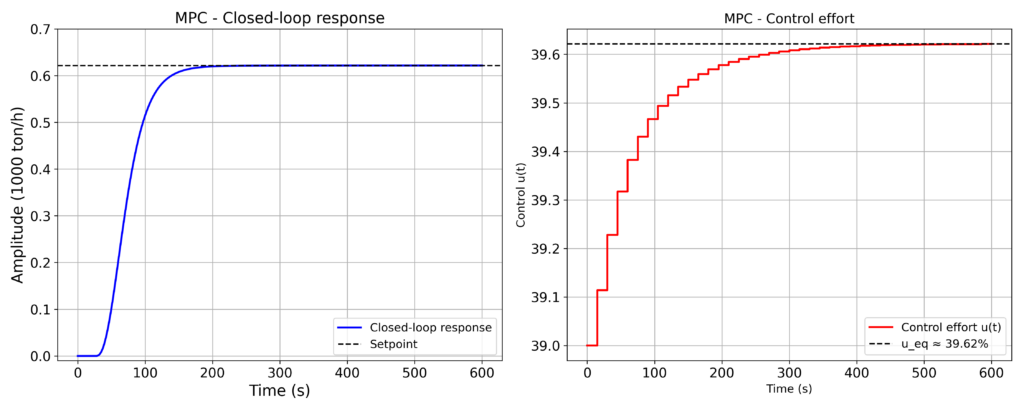
As shown in Figure 6, the MPC guides the process variable to the setpoint of 620 ton/h with a rise time comparable to the Aggressive PID, but with perfect damping. The control effort (red line) is smooth and monotonic, avoiding the “derivative kick” that damages VFDs.
Comparative Results & ROI
The performance of the three proposed strategies was quantified to support the investment decision.
| KPI | Legacy PI | Aggressive PID | MPC (Recommended) | Impact |
| Overshoot | 0% | 15% | 0% | Quality/Waste |
| Settling Time (2%) | 418 s | 355 s | 152 s | Throughput |
| Actuator Wear | Minimal | High | Minimal | Maintenance |
| Complexity | Low | Low | Medium | Implementation |
Conclusion & Recommendation
The analysis confirms that the Bentontie Dosing System can be significantly optimized. The project delivers two validated options for deployment:
- Zero-Cost Improvement (Robust PI): For non-critical batches, updating the existing PLC with “Case A” parameters eliminates overshoot immediately.
- High-Value Optimization (MPC): For continuous production, the MPC is the superior choice. It is the only strategy that simultaneously achieves fast throughput and asset preservation, providing the highest long-term Return on Investment (ROI).